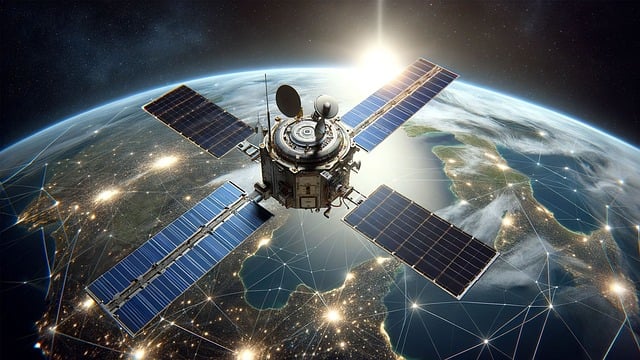
Satellites orbit the Earth, providing different services, such as communications and navigation (Wu, 2023). Some contain specialised cameras and sensors that collect images of the Earth’s surface at different spatial resolutions (image and pixel size) and temporal (how often images are taken) scales, depending on the satellite (Geoimage, 2022; Wu, 2023). These images are sent back to make observations about the Earth at a singular point in time or over many years, such as how coastlines have changed. Earth observation data has historically been difficult and time-consuming to use due to the large amount of information it generates (Tordesillas & Qian, 2022). Geoscience Australia has been developing Digital Earth Australia, a platform to make it easier to access and use satellite information.
This Insight outlines what Digital Earth Australia is and provides examples of how its products can be used, how it can be accessed, and things to keep in mind when using Digital Earth Australia data.
What is Digital Earth Australia?
Digital Earth Australia is an online platform that makes three decades of Australian-specific Earth observation data freely available (Digital Earth Australia, 2023c). It processes and manages satellite imagery to provide analysis-ready data products that users can quickly and easily use. This information is derived from imagery obtained from two sources, the United States Geological Survey’s Landsat program and the European Space Agency’s Sentinel program (Digital Earth Australia, 2021).
Digital Earth Australia delivers data products across several categories, including baseline satellite data, land and vegetation, inland water, sea, ocean and coast, and hazards (Table 1), with several more in development.
Table 1: Digital Earth Australia’s released data products (at the time of publication)
| Category | Products Available |
|---|---|
| Baseline Satellite Data |
|
| Land and Vegetation |
|
| Inland Water |
|
| Sea, ocean and coast |
|
| Hazards |
|
Some examples of the data products include:
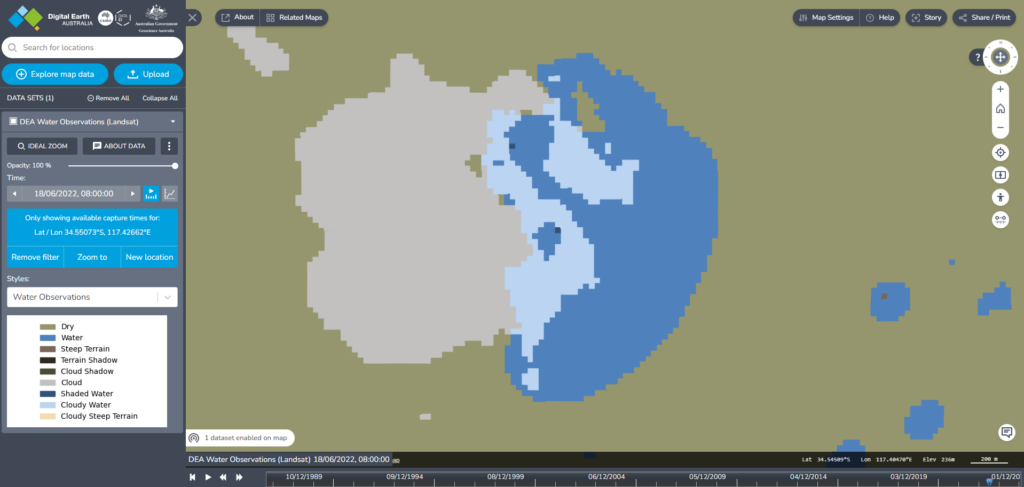
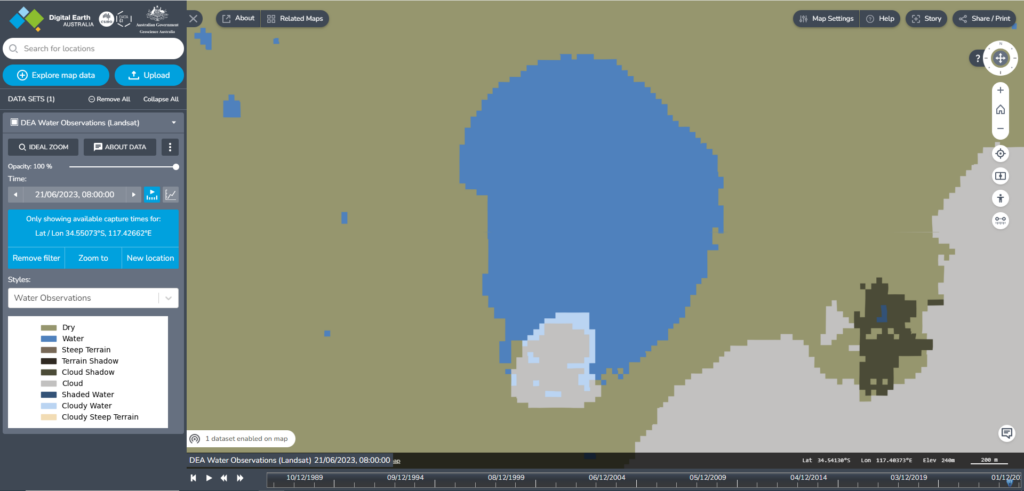
- Tracking the changes in the presence/absence of water or monitoring drought conditions using the inland water category data (Digital Earth Australia, 2024a).
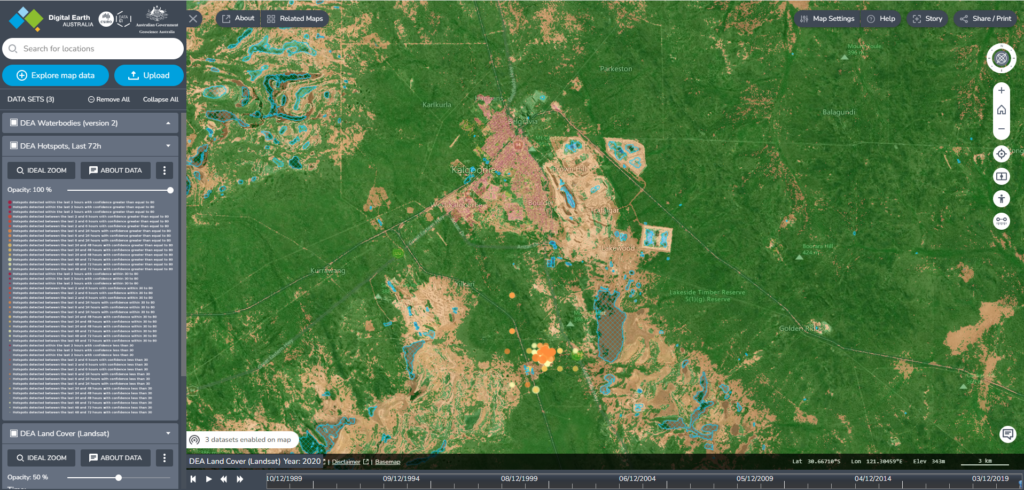
- Combining Hotspots, Water bodies, and Land Cover to model high-risk fire locations, nearby water sources, and at-risk infrastructure to assist with bushfire planning and management (Digital Earth Australia, 2024e).
Accessing the Data
Two options exist for accessing the data from Digital Earth Australia: either online at Digital Earth Australia Maps or via linking to a GIS Application.
To access online, go to Digital Earth Australia Maps (DEA Maps), an interactive map platform where you can browse and explore the data catalogue (except the Wetlands Insight Tool for Queensland, which can be found here) and upload your data for analysis. The platform also provides a short tutorial to assist users in getting started. This platform makes different analytical tools available for the different products and allows you to export the required data extent (except for Waterbodies, Coastlines and Hotspots data).
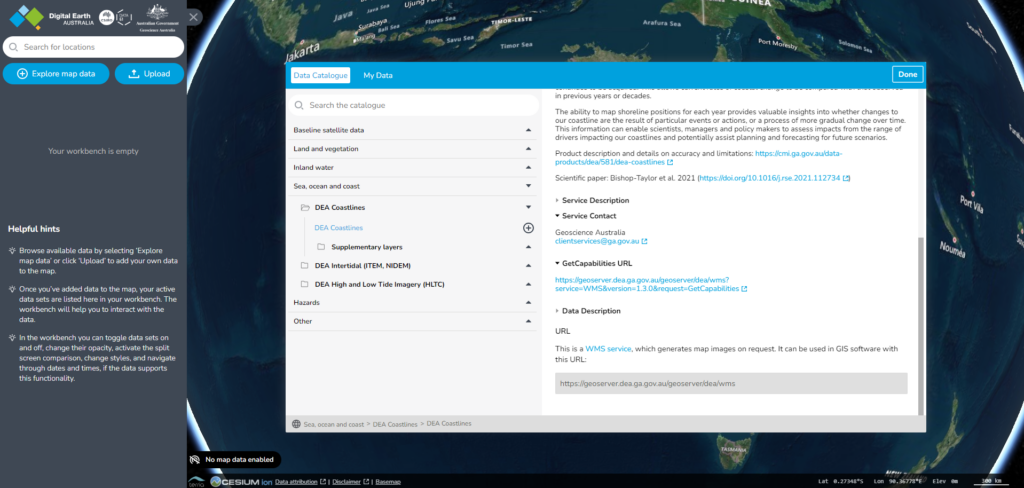
To access the data products via a GIS application, such as QGIS or ArcGIS, occurs via a Web Map Service (WMS) URL connection (Digital Earth Australia, 2024f). WMS links enable GIS users to access georeferenced map images from their desktop applications over the internet, so no downloads are required (Digital Earth Australia, 2024f). A tutorial on how to do this is available here from Digital Earth Australia. The different products can be linked via different URL connections. The Water Observations and Coastlines data can be connected using the URL: https://geoserver.dea.ga.gov.au/geoserver/dea/wms. Hotspots can be connected using the URL https://hotspots.dea.ga.gov.au/geoserver/ows. For the rest of the data products, including the land and vegetation and tidal data, use the URL https://ows.dea.ga.gov.au/. These links can also be found in the data descriptions of each product in the data catalogue on DEA Maps (Figure 4 shows an example of this).
Some information, such as Water Observations and Coastline data, is available as shapefiles (a spatial data file format). These products can be downloaded from their respective data pages on the DEA Knowledge Hub, Water Observations and Coastlines.
Digital Earth Australia is also accessible via the Sandbox, a platform that provides sample data and example analyses to assist new users in getting started with using and analysing the data (Digital Earth Australia, 2022). The DEA Knowledge Hub provides all the information about the data products and Digital Earth Australia’s services in one place (Digital Earth Australia, 2023a).
Things To Keep In Mind
Some things to keep in mind when using the Digital Earth Australia information:
- Most products rely on Landsat imagery, including land cover, water bodies and coastlines (Digital Earth Australia, 2024b). Landsat data is not always accurate or reliable as it is affected by cloud cover, relies on ageing technology and takes several days to capture the Australian landscape (Digital Earth Australia, 2023b). Many of the data products, however, are undergoing development to combine Sentinel and Landsat information (Digital Earth Australia, 2023d).
- The models used to classify the satellite images to create the derivative data products rely on a satellite spatial resolution that may not be able to distinguish the Earth’s surface clearly or evaluate dynamic natural processes that cannot easily be captured and understood (Digital Earth Australia, 2024d; Digital Earth Australia, 2024c). This can create inconsistencies between the data products and data collected in the field.
- The availability of historical information for certain data products varies in desktop GIS applications as the data products are updated at different frequencies. For example, only the most recent satellite observation (one to two north-south strips of Australia’s surface) is available for Water Observations using the live connection in QGIS. Meanwhile, in DEA Maps, you can use the tools to examine all the available Water Observation data over time.
The Digital Earth Australia platform makes it easier to access and use the Earth observation information produced from satellites. The Integrate Sustainability team has extensive experience in creating, interpreting, and analysing spatial data. If you are interested in exploring the use of spatial data for your business, call us at 08 9468 0338 or email enquiries@integratesustainability.com.au.
References
Digital Earth Australia. (2021, February 01). What is analysis-ready data? Retrieved from Digital Earth Australia: https://www.dea.ga.gov.au/about/analysis-ready-data
Digital Earth Australia. (2022). Introduction to the DEA Sandbox. Retrieved from Digital Earth Australia: https://www.dea.ga.gov.au/developers/sandbox
Digital Earth Australia. (2023a). DEA knowledge hub. Retrieved from Digital Earth Australia Knowledge Hub: https://docs.dea.ga.gov.au/
Digital Earth Australia. (2023b). Frequently asked questions. Retrieved from Digital Earth Australia Knowledge Hub: https://docs.dea.ga.gov.au/guides/about/faq/#how-do-i-download-data-from-dea
Digital Earth Australia. (2023c, February 08). Our mission: Putting satellite data into decisions. Retrieved from Digital Earth Australia: https://www.dea.ga.gov.au/about/our-mission
Digital Earth Australia. (2023d, February 27). Significant milestone reached in Sentinel-2 Collection 3 migration. Retrieved from Digital Earth Australia: https://www.dea.ga.gov.au/news/sentinel-2-collection-3-migration
Digital Earth Australia. (2024a, January). Agriculture. Retrieved from Digital Earth Australia: https://www.dea.ga.gov.au/sector/agriculture
Digital Earth Australia. (2024b). Data products. Retrieved from Digital Earth Australia: https://www.dea.ga.gov.au/products
Digital Earth Australia. (2024c). DEA High and Low Tide imagery (Landsat). Retrieved from Digital Earth Australia: https://docs.dea.ga.gov.au/data/product/dea-high-and-low-tide-imagery-landsat/
Digital Earth Australia. (2024d). DEA Waterbodies (Landsat): FAQs. Retrieved from Digital Earth Australia: https://docs.dea.ga.gov.au/data/product/dea-waterbodies-landsat/
Digital Earth Australia. (2024e, January). Emergency Management. Retrieved from Digital Earth Australia: https://www.dea.ga.gov.au/sector/emergency-management
Digital Earth Australia. (2024f, January). Web map service (WMS). Retrieved from Digital Earth Australia: https://docs.dea.ga.gov.au/guides/setup/gis/web_map_service/
FrontierSI. (2021, November). Digital Earth Australia and the mining and METs industries: Extracting the benefits of Earth observation. Retrieved from FrontierSI: https://frontiersi.com.au/wp-content/uploads/2021/11/FrontierSI_DigitalEarth_ExtractingEarthObservation_SECOND_RELEASE_FINAL.pdf
Geoimage. (2022, October 10). What is satellite imagery?: A complete guide. Retrieved from Geoimage: https://geoimage.com.au/blog/what-satellite-imagery-complete-guide
Tordesillas, A., & Qian, G. (2022, December 05). The satellite data mapping Australia’s new climate extremes. Retrieved from Pursuit: https://pursuit.unimelb.edu.au/articles/the-satellite-data-mapping-australia-s-new-climate-extremes
Wu, Q. (2023, March 14). How to use free satellite data to monitor natural disasters and environmental changes. Retrieved from The Conversation: https://theconversation.com/how-to-use-free-satellite-data-to-monitor-natural-disasters-and-environmental-changes-198140