In the last few years, technology has advanced significantly, and this is also the case for Geographic Information Systems (GIS). The tools designed to capture, analyse, manage, and present spatial or geographic data on a large scale, have now become essential tools for decision-makers across many disciplines. As most of us are aware, spatial and remote sensing information is also beneficial for environmental professionals for planning and balancing impacts on the environment. However, in the past, one of the most significant limitations for using spatial and remote sensing tools has been the cost of purchasing data. This InSight discusses a range of free tools available to develop your GIS skills and where to obtain free data online. You have got to love cool, free stuff.
![]() 1 – EARTH EXPLORER
1 – EARTH EXPLORER
Earth Explorer is one of the most popular satellite image sources in the world. This tool is very useful, and it contains a wide range and variety of data. If you want to access or download the data, you will need to register through Earth Explorer website.
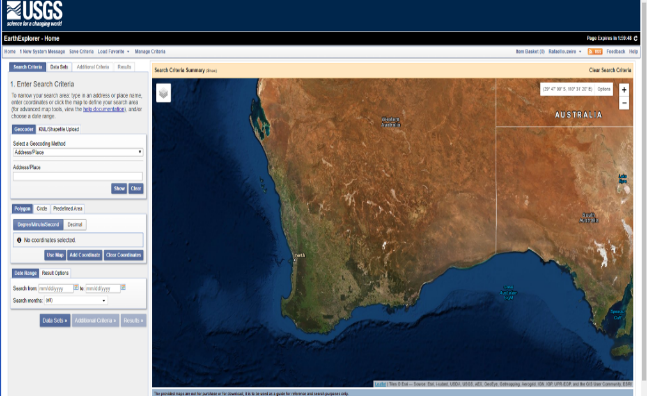
There is a wide range of information and data available to extract from Earth Explorer; including Aerial Imagery, CEOS Legacy, Declassified Data, Digital Elevation, Digital Line Graphs, Digital Maps, Global Fiducials, Land Cover, Landsat, NASA Collections, Radar, Sentinel and Vegetation Monitoring ISRO Resourcesat. The platform is very user friendly, and easily find what you need to work (U.S. Department of the Interior 2020).
Using data from Earth Explorer, you can conduct several different environmental analyses. If you want to analyse different terrain parameters, where elevation data is needed, you can use a DEM (Digital Elevation Models) from the Shuttle Radar Topography Mission – SRTM. You can also use a combination of images (spectral bands) from satellites such as Landsat and Sentinel to analyse the natural hazards that threaten lives and livelihoods, water, energy, minerals, and other natural resources. If you are familiar with remote sensing, you can calculate the NDVI (Normalised difference vegetation index) to measure vegetation health, and the impacts of climate and land-use change.
![]() 2 – LANDVIEWER
2 – LANDVIEWER
Landviewer is a mix of free and paid GIS data. The tool has an easy-to-master interface that gives us the opportunity to use satellite imagery in high-resolution for almost free. If you have a restricted budget, you can find cheap satellite images with resolutions up to 40 cm per pixel. With Landview you can get the most up-to-date satellite images from Landsat 7 and 8, Sentinel-1 and 2, CBERS-4, MODIS, aerial data from NAIP, or get Landsat 4 and 5 historical satellite images. You can also retrieve satellite images from some of the newer satellites such as SPOT 5-7, Pleiades-1, Kompsat-2, 3, 3A, SuperView-1.
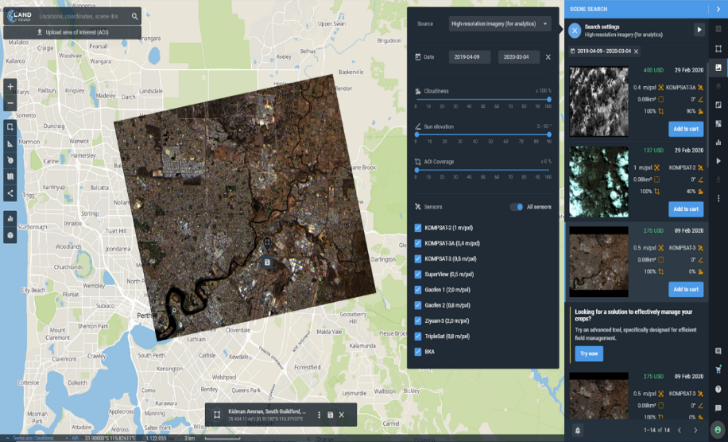
When trying to locate available imagery, you can use Landviewer to identify the quality and prices of the Satellite images. You can use Landviewer images to undertake many different analyses, with over 20 default band combinations and indexes such as NDVI, NBR, SAVI, the raster calculator-like custom index builder, time series analysis and clustering. The Landviewer platform is also great for GIS beginners and experts who would like to acquire a new skill (Earth Observing System 2020).
![]() 3 – DIGITALGLOBE
3 – DIGITALGLOBE
If you want quality RGB (colour image as we see naturally) satellite imagery, you should check out DigitalGlobe. They have a lot of free data available in their library. Typically, the images are used to build footprints, elevation, stereo and true-colour imagery of 30cm high-resolution.
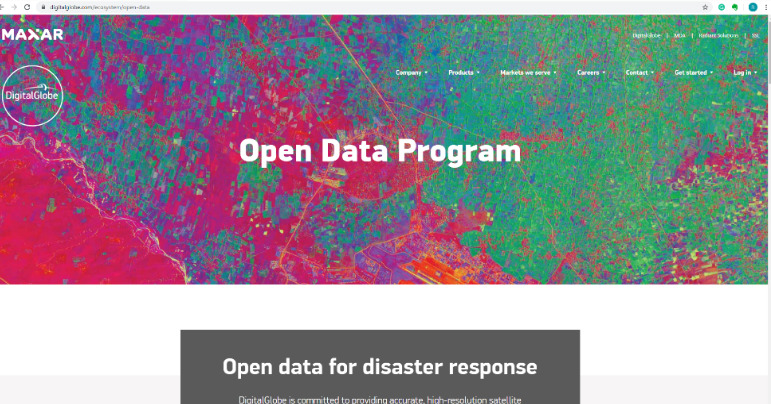
Data for fires, floods, hurricanes (cyclones), typhoons, and earthquakes is also available from DigitalGlobe through the initiative called “Open data for disaster response”. This initiative made the company more popular and well-known around the world. During Australia’s recent bushfires, it was possible to identify 130 bushfire points across forests and national parks using DigitalGlobe’s initiative (https://www.digitalglobe.com/ecosystem/open-data/australia-wildfires). And in 2019, DigitalGlobe tracked the 2.2 million acres of land burnt during the great Amazon fires. If you need data to analyse natural catastrophes, DigitalGlobe is the perfect solution (DigitalGlobe 2020).
![]() 4 – GOOGLE EARTH ENGINE
4 – GOOGLE EARTH ENGINE
A tool that has become more popular and interesting to the public is Earth Engine. Initially, it was mostly used by developers. However, everyone can access Google Earth Engine through the website https://earthengine.google.com/ and use their easy-to-use tools. This website combines a catalogue of satellite images and geospatial data sets with analytical resources on a planetary scale, and it provides change detection, trend mapping and quantification of differences of the Earth’s surface.
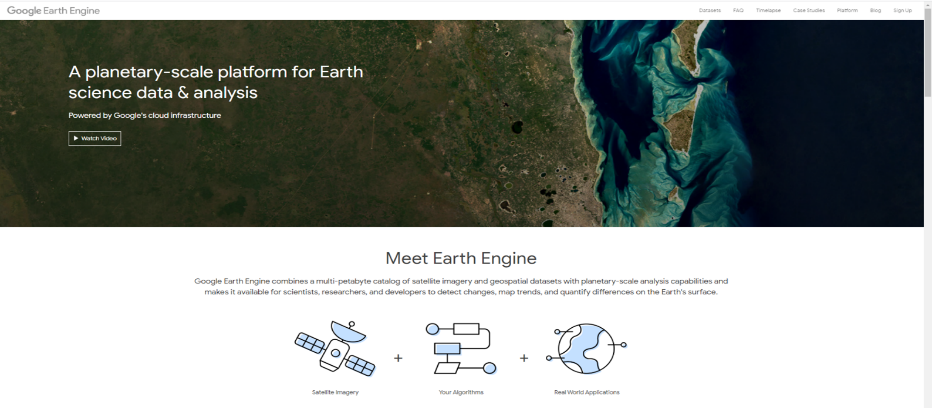
It looks very complex, but it is possible to enjoy the platform using the time-lapse analysis. This feature allows you to see the advance of natural phenomena, such as forest fires and deforestation, and also the advancement of infrastructure and mining. The archive includes more than thirty years of historical images and scientific data sets, updated and expanded daily. There are more than twenty petabytes of geospatial data available instantly for analysis (Google Earth Engine 2020).
![]() 5 – AUSTRALIA DATA SOURCES
5 – AUSTRALIA DATA SOURCES
In Australia, there is a lot of free data available. Below are a few sources that Integrate Sustainability use on a regular basis.
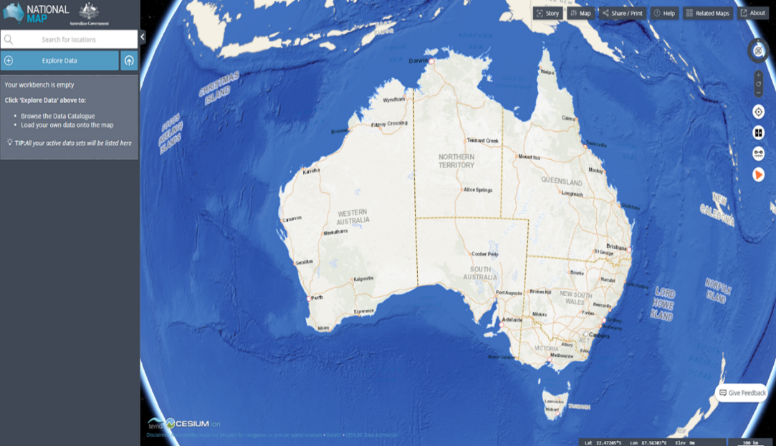
National Map
National Map is an online platform that allows access to spatial data from numerous Commonwealth and State government agencies. National Map contains a range of data sets such as vegetation, soil, terrain, water, climate, community and population characteristics, land use, agricultural commodity, income, land value, and other Australian data (Digital Transformation Agency, Department of Communications and Arts, and CSIRO 2014-2018.).
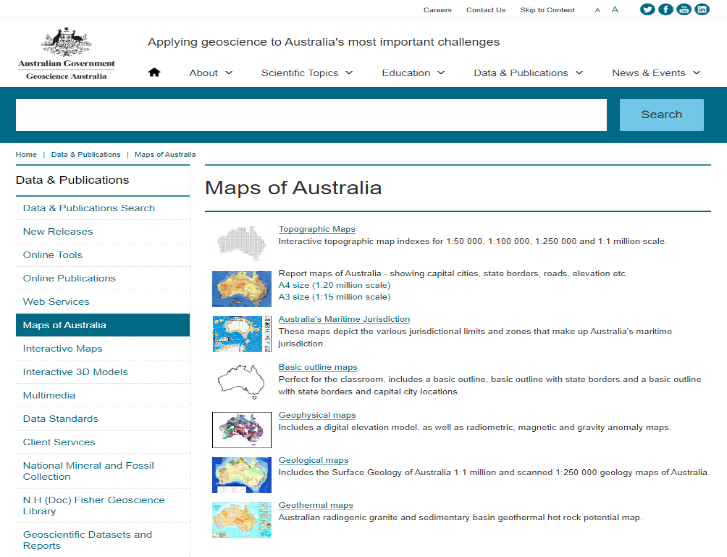
Geoscience Australia
One of the data sources that is linked to National Map is Geoscience Australia. Through this portal you can find LIDAR images, topographic maps indexes for 1:50 000, 1:100 000, 1:250 000 and 1:1 million scale and geologic maps indexes for 1:50 000, 1:100 000, 1:250 000 and 1:1 million scales. The Geoscience Australia website also has data sources on topics such as Biota, Boundaries, Climatology, Disaster, Economy, Elevation, Environment, Geoscientific, Imagery base maps, Inland waters, Location, Oceans, Society, Structure, Transportation, and Utilities communication (Commonwealth of Australia 2020).
Also accessible through the Geoscience Australia website is “Australian Flood Risk Information Portal”. This portal provides a range of data analysis on the safety and sustainability of Australian infrastructure, communities and the environment. It is an important component in the provision of reliable and robust estimates of flood risk, Multisite Rainfall Simulator, Joint Probability Modelling in Estuarine Regions and Design Rainfalls.
But wait, there’s more
There are countless free or open sources data portals in Australia. Below is a list of websites that might be useful to Environmental Practitioners, and other GIS users, in Australia or Western Australia:
- DAFWA NRMinfo for WA soil, vegetation and land quality information
- DAFWA WeedWatcher for WA weed records
- DMIRS GeoView and Tengraph for WA mining and geological information
- Project Dieback Public Map and Dieback Information and Delivery Management System for Dieback infected areas and management
- NatureMap for WA flora and fauna records
- Atlas of Living Australia for Australia-wide flora and fauna records
- Earth Observation: Data, Processing and Applications is an Australian Earth Observation (EO) community undertaking to describe EO data, processing and applications in an Australian context and includes a wide range of local case studies to demonstrate Australia’s increasing usage of EO data.
- Data WA – this website contains thousands of datasets located in SLIP. Most of the data can be viewed directly by anyone through SLIP public maps. We encourage you to explore what is available through SLIP via data.wa.gov.au. The information available via Data WA and SLIP is a mixture of free and subscription data.
- Department of Water and Environmental Regulation – The department collects information on surface water and groundwater levels, flows and quality, in addition to meteorological data. This allows the department to determine such things as surface water and groundwater availability throughout the state, water levels and quality in the Gnangara and Jandakot mounds, state-wide and regional water quality (Government of Western Australia 2020).
Integrate Sustainability has extensive experience with GIS Data analysis and using Remote Sensing data during research and Environmental Impact Assessments. If you or your business needs GIS support or requires an environmental assessment report, call Integrate Sustainability 08 08668 0338 or email enquiries@integratesustainability.com.au
References
Commonwealth of Australia . 2020. Geoscience Australia. Accessed 03 26, 2020. https://www.ga.gov.au/.
Digital Transformation Agency, Department of Communications and Arts, and CSIRO. 2014-2018. NationalMap. Accessed 03 16, 2020. https://nationalmap.gov.au/about.html.
DigitalGlobe. 2020. https://www.digitalglobe.com/. Accessed 03 25, 2020.
Earth Observing System. 2020. https://eos.com/landviewer. Accessed 03 26, 2020.
Google Earth Engine. 2020. https://earthengine.google.com/. Accessed 03 25, 2020.
Government of Western Australia. 2020. Department of Water and Environmental Regulation. Accessed 03 26, 2020. https://www.water.wa.gov.au/maps-and-data/monitoring.
U.S. Department of the Interior. 2020. https://earthexplorer.usgs.gov/. Accessed 03 25, 2020.