Pollution is the release of any substance (solid, liquid, or gas) or any form of energy (heat, sound, or radioactivity) into the environment at a rate faster than it can be dispersed, diluted, decomposed, recycled, or stored into some harmless form (Nathanson, 2021). If not controlled appropriately, the release of these substances can cause negative effects on human health and the environment.
The National Pollutant Inventory (NPI) was established as a measure by the National Environment Protection Council under the National Environment Protection Council Act 1994. The NPI monitors the release of 93 substances into the environment while ensuring the community has access to or is aware of these releases (Department of Agriculture, Water and the Environment, 2014a).
The National Greenhouse and Energy Reporting (NGER) scheme was established by the National Greenhouse and Energy Reporting Act 2007 (NGER Act). NGER is a single national framework for reporting and publishing information about greenhouse gas emissions, energy production, energy consumption and other information specified under NGER legislation (Clean Energy Regulator, 2019a).
Reporting
All industry facilities which exceed an NPI reporting threshold must report emissions and transfers for all relevant substances. NPI reports must be submitted within three months of the nominated reporting period, whether reporting on a financial year or calendar year basis. Reporting thresholds for all substances monitored by the NPI can be found in the NPI Guide (Department of the Environment, 2015).
Similarly, all industrial facilities that exceed an NGER reporting threshold must submit an NGER report to the Clean Energy Regulator by 31 October each year. Under the NGER Act, two types of thresholds determine which companies have an obligation (Clean Energy Regulator, 2021a); facility threshold and corporate group threshold. Facility threshold includes industry facilities producing 25kt or more greenhouse gases (CO2-e) (scope 1 and scope 2 emissions) or the production or consumption of 100TJ or more energy. Corporate group thresholds include industry facilities producing 50kt or more of greenhouse gases (CO2-e) (scope 1 and scope 2 emissions), or the production or consumption of 200TJ or more energy. To demonstrate how informative the NPI and NGER can be for the community, the remainder of this InSight presents examples of the information reported.
NPI Results for Total Air Emissions of PM10
Particulate Matter with a diameter of less than 10 micrometres (µm), also known as PM10, is a common air pollutant and is typically in dust and smoke (DEC, 2011; Department of Agriculture, Water and the Environment, 2021). Particles of this size can cause impacts on human health and the environment. High levels of PM10 can make a person cough and sneeze, make your eyes sting, nose run and cause difficulty breathing (DEC, 2011; EPA Victoria, 2021). Airborne dust can impact visibility, and the dust settling on leaves can prevent plants from photosynthesising (DEC, 2011).
The total air emissions of PM10, inclusive of point and fugitive sources, for New South Wales (NSW), Queensland (QLD), South Australia (SA), Victoria (VIC) and Western Australia (WA) are presented in figure 1 for the last 10 years (NPI, 2021). Within Australia, WA and QLD are the two biggest emitters of PM10 (NPI, 2021), this is linked to the types of industry, the number of reporting facilities and the size of the state. We acknowledge that data is also available for ACT, Tasmania and Northern Territory we have just not included them in the chart.
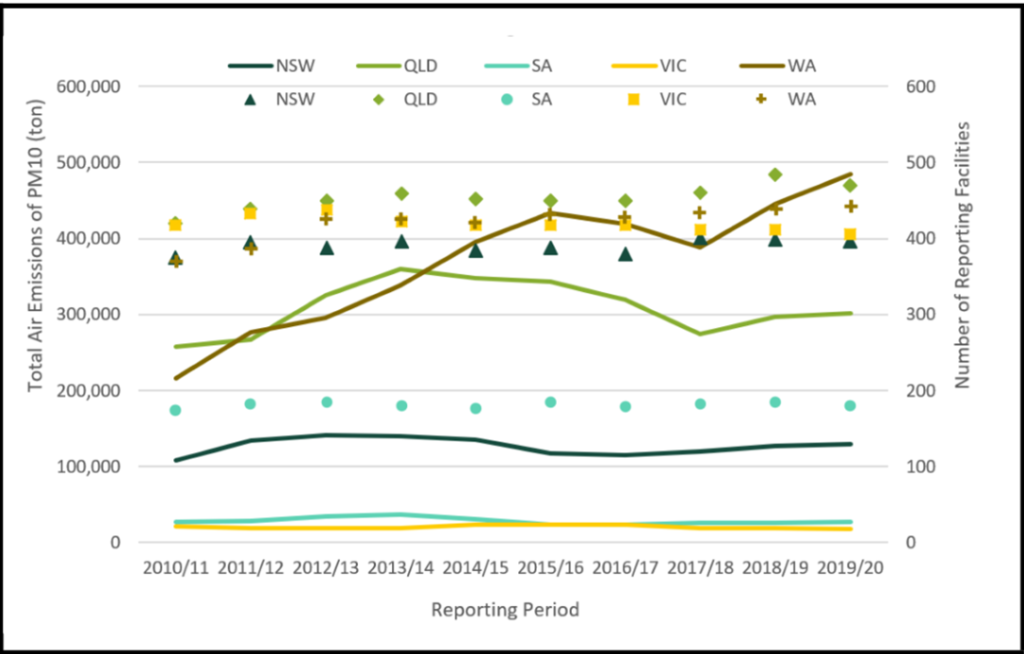
The total air emissions of PM10 for WA have increased by almost 270 thousand tonnes over the past 10 years (NPI, 2021), even with a decrease 2017/18. QLD reported an increase between the 2010/11 and 2013/14 reporting periods, then a decrease until 2017/18, when another slight increase in emissions was observed for the last two reporting periods (NPI, 2021). PM10 emissions for NSW, SA and VIC have been relatively steady over the past 10 years (NPI, 2021).
In Western Australia, the top three largest PM10 emitters for the 2019/20 period were Solomon Hub (approximately 30 thousand tonnes), Christmas Creek (approximately 30 thousand tonnes), and Mining Area C (approximately 27 thousand tonnes); all three facilities were related to Iron Ore Mining (NPI, 2021).
An interesting point was found when comparing the results for WA and Victoria; the number of reporting facilities is both around 400. However, the total air emissions differ significantly between the states. When looking at the Victorian results for the 2019/20 period, 89 different industries reported PM10 emissions and the most common reporting facilities related to Hospitals excluding Psychiatric Hospitals (27), Waste Treatment and Disposal Services (23) or Milk and Cream Processing (18) (NPI, 2021). In comparison, WA had 64 different industries reporting total air emissions of PM10 for the 2019/20 period, with the types of facilities reporting mostly occurring in the Fossil Fuel Electricity Generation (62), Gold Ore Mining (56), Gas Supply (48) or Iron Ore Mining (33)(NPI, 2021).
NPI Results for Total Air Emissions of SO2
Sulphur dioxide (SO2) is a pollutant commonly associated with coal-burning power plants, oil refineries and metal smelting, particularly from sulphide containing ores including gold, nickel, lead, silver and zinc ores (Department of Agriculture, Water and the Environment, 2019). When SO2 is emitted into the atmosphere, it reacts with water, oxygen and other chemicals to form sulphuric acid. Sulphuric acid in the atmosphere that precipitates and falls to the ground is commonly called acid rain (EPA, 2021).
Liquid SO2, when exposed to the skin and eyes, can cause burns, while inhalation of SO2 can cause respiratory tract inflammation, wheezing, coughing and shortness of breath (EPA Victoria, 2021). Deposits from acid rain will adversely affect both land and water ecosystems (Department of Agriculture, Water and the Environment, 2019).
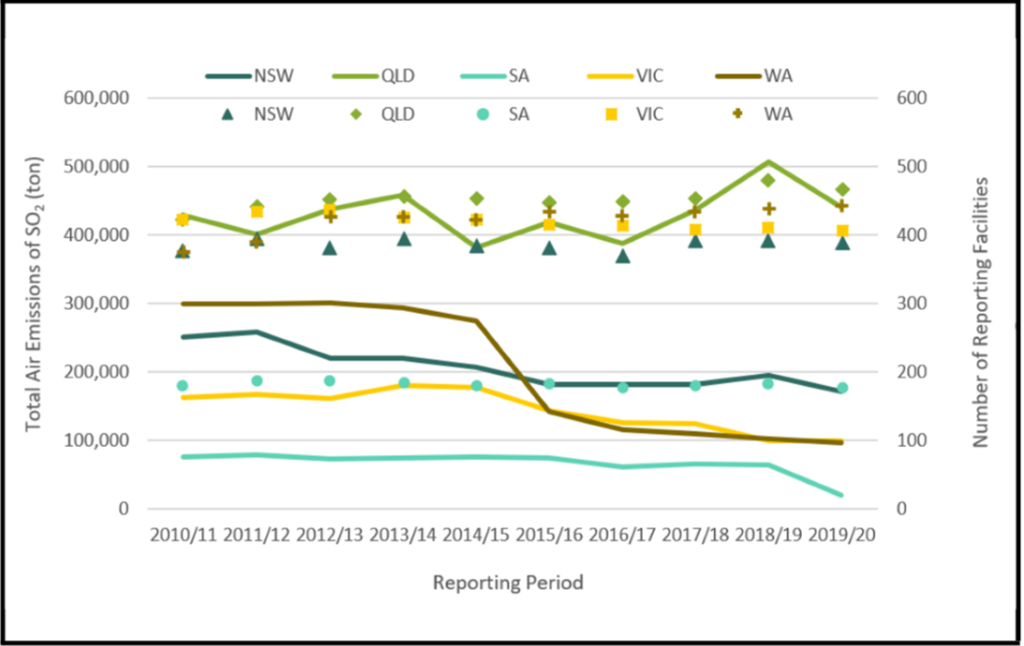
The total air emissions of SO2, including point and fugitive sources, for NSW, QLD, SA and VIC and WA are presented in figure 2. Within Australia, QLD has been the largest emitter of SO2 over the past ten years. WA’s emissions have seen a reduction in SO2 since the 2012/13 reporting period (NPI, 2021).
The most significant emitters of SO2 change from year to year. In Western Australia, for the 2019/20 period, the top three SO2 emitters were Muja Power Station (approximately 23 thousand tonnes), Kanowna Belle Operations (approximately 15 thousand tonnes) and Bluewaters Power Station No 1&2 (approximately 14 thousand tonnes) (NPI, 2021). The Muja Power Station and the Bluewaters Power Station No 1&2 are both coal-fired power stations. A staged retirement of Muja Power Station is planned to commence in October 2022 (Government of Western Australia, 2019). While the Kanowna Belle Operations are associated with the Gold Ore Mining Industry, it is essential to acknowledge that multiple sources within this industry emit SO2 (NPI, 2021). A large proportion of the emissions at Kanowna Belle is associated with the gold roaster, with other emissions generated by vehicles and electricity generation (DEC, 2010).
NGERS Reporting
Greenhouse Gas emissions can be broken down into three scopes (figure 3) and reported based on direct and indirect emissions (Meersma, 2021):
- Scope 1: evaluates direct emissions from sources owned or controlled by the organisation.
- Scope 2: evaluates electricity-related emissions organisation-wide.
- Scope 3: evaluates value chain emissions from both upstream and downstream of an organisation’s supply chain.

For the 2019/20 reporting period, 915 corporations across Australia reported a total of 327 million tonnes of scope 1 greenhouse gas emissions (Clean Energy Regulator, 2021b). QLD was the largest emitting state contributing 28.6%. Victoria was next in line at 25.6%, followed by WA at 20.9%. Electricity generation remained the highest emitting industry in QLD, Victoria, SA and NSW, while oil and gas production continued to be the highest emitting industry in WA.
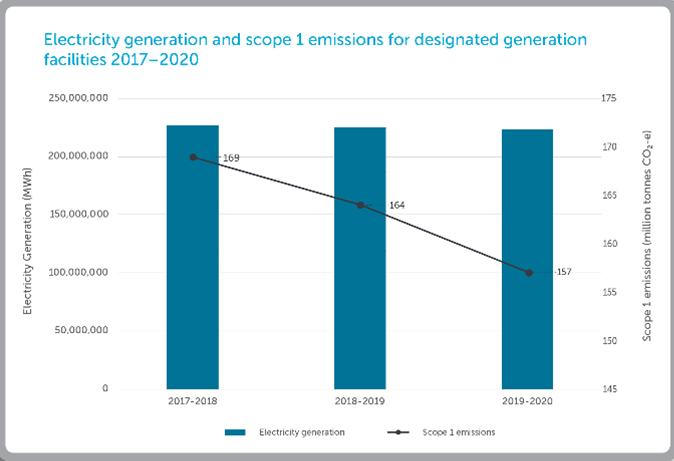
Compared to the 2018/19 reporting period, a decrease of 10.1 million tonnes (3%) of scope 1 emissions was recorded. This 3% decrease was contributed mainly by the increased use of renewable energy and less brown coal use, which led to a 7.5 million tonnes decrease in the electricity sector compared to the previous year (Clean Energy Regulator, 2021b). Over the last three reporting periods, emissions in the electricity generation sector have shown a decreasing trend (Figure 4).
In addition, 86 million tonnes of indirect scope 2 greenhouse gas emissions were reported for the 2019-20 period, which is a 3% decrease from the 88 million tonnes of scope 2 emissions reported for the 2018-19 period (Clean Energy Regulator, 2021b).
Keys Dates and How We Can Help
If you are reporting your emissions to the NPI on a financial year basis, the deadline for submitting your NPI emissions report is the 30th of September, while reporting of emissions and energy information under the NGER scheme must be submitted by 31st of October (Department of Agriculture, Water and the Environment, 2014b).
The team at Integrate Sustainability has a wealth of experience in data collection associated with NPI and NGER reporting. If you or your organisation would like to learn more about NPI and NGER, or require assistance, please get in touch with us by email at enquiries@integratesustainability.com.au or call us on 08 9468 0338.
References
Clean Energy Regulator. (2019a, May 17). About the National Greenhouse and Energy Reporting scheme. Retrieved from National Greenhouse and Energy Reporting: http://www.cleanenergyregulator.gov.au/NGER/About-the-National-Greenhouse-and-Energy-Reporting-scheme
Clean Energy Regulator. (2021a, July 1). Reporting Threshold. Retrieved from National Greenhouse and Energy Reporting: http://www.cleanenergyregulator.gov.au/NGER/Reporting-cycle/Assess-your-obligations/Reporting-thresholds
Clean Energy Regulator. (2021b, February 25). 2019–20 National Greenhouse and Energy Reporting emissions and energy data now available. Retrieved from National Greenhouse and Energy Reporting: http://www.cleanenergyregulator.gov.au/NGER/Pages/News%20and%20updates/NewsItem.aspx?ListId=19b4efbb-6f5d-4637-94c4-121c1f96fcfe&ItemId=897
DEC. (2010). Ambient Monitoring of Sulfur Dioxide in Kalgoorlie, 1999-2008. Department of Environment and Conservation. Retrieved from https://www.der.wa.gov.au/images/documents/your-environment/air/publications/Ambient_Monitoring_of_Sulfur_Dioxide_in_Kalgoorlie_1999-2008.pdf
DEC. (2011). A guideline for managing the impacts of dust and associated contaminants from land development sites, contaminated sites remediation and other related activities. Department of Environment and Conservation.
Department of Agriculture, Water and the Environment. (2014a, June 2). About the NPI. Retrieved from National Pollutant Inventory: http://www.npi.gov.au/about-npi
Department of Agriculture, Water and the Environment. (2014b, June 2). Reporting emissions and transfers. Retrieved from National Pollutant Inventory: http://www.npi.gov.au/reporting
Department of Agriculture, Water and the Environment. (2019, February 22). Sulfur dioxide. Retrieved from NPI: http://www.npi.gov.au/resource/sulfur-dioxide
Department of Agriculture, Water and the Environment. (2021, July 22). Particulate matter (PM10 and PM2.5). Retrieved from NPI: http://www.npi.gov.au/resource/particulate-matter-pm10-and-pm25
Department of the Environment. (2015). National Pollutant Inventory Guide Version 6.1. National Pollutant Inventory.
EPA. (2021, July 8). What is Acid Rain? Retrieved from EPA: https://www.epa.gov/acidrain/what-acid-rain
EPA Victoria. (2021, March 16). PM10 particles in the air. Retrieved from EPA Victoria: https://www.epa.vic.gov.au/for-community/environmental-information/air-quality/pm10-particles-in-the-air
EPA Victoria. (2021, June 15). Sulfur dioxide in the air. Retrieved from EPA Victoria: https://www.epa.vic.gov.au/for-community/environmental-information/air-quality/sulfur-dioxide-in-the-air
Meersma, K. (2021, August 4). Three Steps for Greenhouse Gas Emissions Reporting. Retrieved from Dewberry: https://www.dewberry.com/insights-news/post/blog/2021/04/08/three-steps-for-greenhouse-gas-emissions-reporting
Morton, A. (2020, February 24). Australia’s carbon emissions fall just 0.3% as industrial pollution surges. Retrieved from The Guardian: https://www.theguardian.com/environment/2020/feb/24/australia-carbon-emissions-fall-industrial-pollution-surges-electricity-agriculture-lng
Nathanson, J. (2021). Pollution. Retrieved from Britannica: https://www.britannica.com/science/pollution-environment
NPI. (2021, April 2021). Latest NPI emission data – 2019-2020. Retrieved from data.gov: https://data.gov.au/dataset/ds-dga-043f58e0-a188-4458-b61c-04e5b540aea4/details