Remote sensing (RS) is the collection of physical characteristics of an area based on measuring radiation and reflection from a distance, such as an aircraft, drones and satellites (USGS 2020). RS datasets have been collected from satellites for decades with much of this data is stored in large datasets, and the potential information is not fully realised or utilised. Until recently, the possibility of processing RS data has been limited for available software. With the recent release of more efficient software that is able to process multiple parameters collected through RS over short periods, things have changed. These processing tools are handy for quickly analysing environmental and climate parameters over a target area. In this space, Google has developed a cloud computing platform called Google Earth Engine (GEE), which is open-source and free.
Google Earth Engine
The GEE platform stores historical satellite imagery and allows programming with JavaScript language to undertake geospatial analyses. Applications include forest and water coverage, land-use change, vegetation health, disease outbreak, fire management, temperature and weather, and many others (Gorelick 2017). GEE was launched in 2010, and it is the tool that most users would be familiar with to produce time-series images through the “Google Earth Timelapse” in Google Earth. More recently, the GEE has been utilised for analysing RS datasets and used in many different areas of study, including:
- Forest and vegetation analyses;
- Land use and land cover studies;
- Ecosystem and sustainability;
- Wetland and hydrology;
- Agriculture, and
- Other applications. (Meisam Amani 2020).
Google Earth Engine – How it can help?
There are many benefits of the GEE that make it a useful tool for data analysis and RS worldwide. For examples:
a) Access and Use
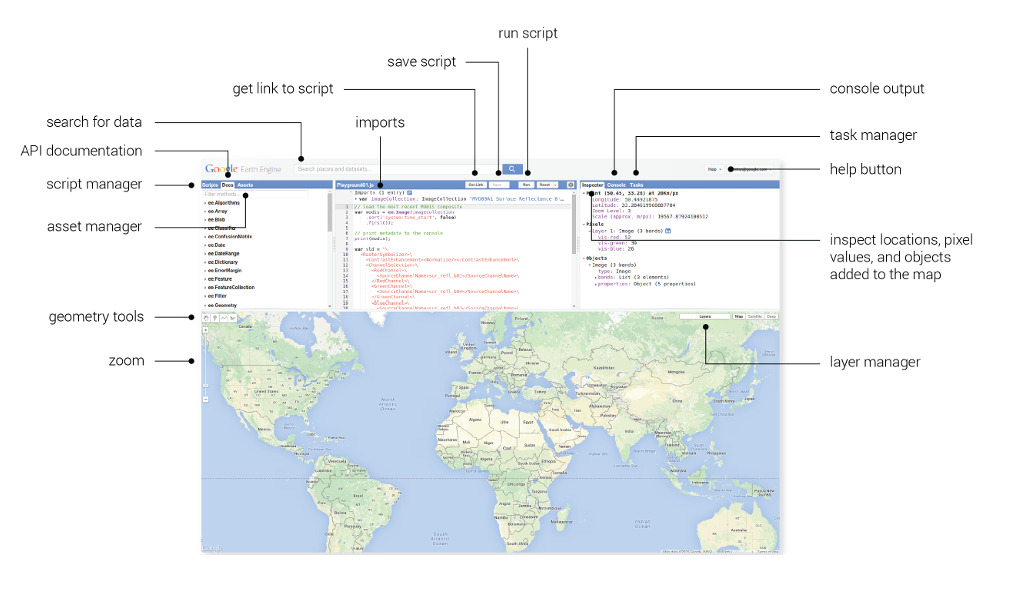
First of all, to use GEE you need to sign up and log in through the GEE website (https://signup.earthengine.google.com). Once you have logged in, it will provide access to the GEE homepage and datasets, as shown in Figure 1. The platform can be accessed simply by having an internet connection.
As a Google tool, GEE has the advantage of linking and using data from other Google products such as Google Colab and Google Drive. It means that any RS data saved to these Google products can be accessed and analysed using the GEE.
Using GEE requires some knowledge in JavaScript language to write codes to instruct analysis. With several lines of code, the GEE can perform calculations on large datasets. Don’t be disheartened as even with no, or limited, knowledge of JavaScript the GEE can still be used. Google has produced a handy guide to help with generating and writing codes (https://developers.google.com/earth-engine/guides). As an open-source tool, many codes have already been developed and are available online to undertake particular interest analyses.
b) Fast processing and high performance
Instead of calculating on only one computer, the GEE can distribute the processing work to multiple computers reducing the processing time. In some cases, satellite image has already undergone a level of basic processing. This means faster processing of RS datasets, which results in quicker turn around time for users at a lower cost.(Gorelick 2017).
The GEE interface has a huge database of satellite imagery and pre-processed datasets. It is organised on the “Earth Engine Data Catalog” (Figure 2) with the datasets categorised by:
- Climate and Weather – Here, you can find out information like Surface Temperature, Climate, Atmospheric and Weather;
- Imagery – In this section of the catalogue, you will find out some of the most used satellite images like Landsat, Sentinel, MODIS and also some high-resolution images; and
- Geophysical – The most used geophysical data found in the catalogues are the Digital Elevation Models (DEMs), Landcover, Normalized Difference Vegetation Index (NDVI) and Cropland.
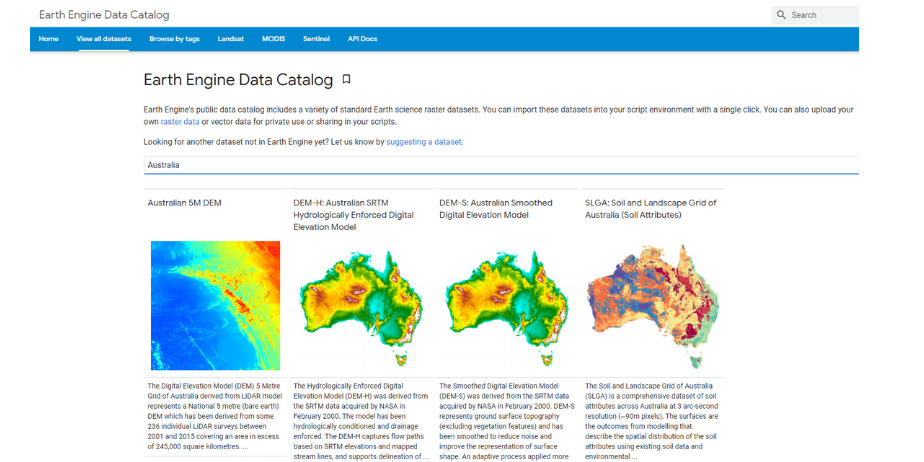
Users can access and use the pre-processed datasets to create their own analyses or access the imagery and raw data for analysis. For Australian users, some of the Australian data available include the “Australian 5M DEM”, “DEM SRTM Hydrogeology and Smoothed” and “Soil and Landscape Grids of Australia.
c) Functionality
The GEE has huge potential to calculate and analyse data for a range of purposes. Some of the basic functions of the GEE include:
- Calculating spectral indices;
- Cloud masking and use to collections of imagery; and
- Time-series charts including creating graphs in the GEE that show the “time X data” relation and represent the result of the data analysed, such as average NDVI values.
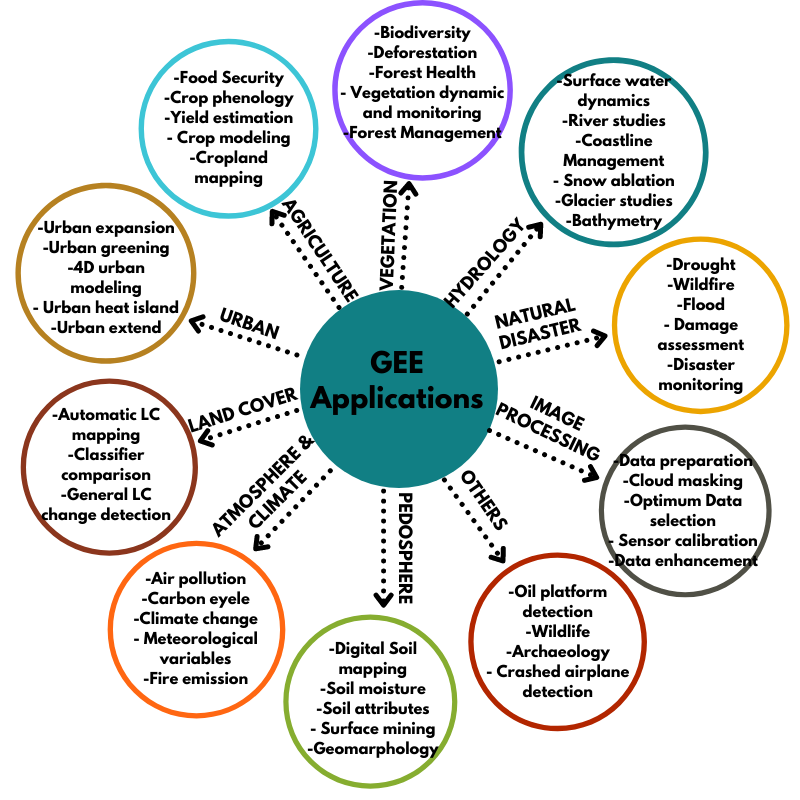
There are hundreds of other tools and features in the GEE (Figure 3). To find out more, visit the GEE website or other websites like “Spatial Thoughts” (Gandhi 2021).
Real Uses of the Google Earth Engine in Environmental Sciences
Below are examples of how the GEE has been used in the environmental sciences to answer complex questions and management of the natural world.
1. Vegetation
The GEE has huge potential for analysing vegetation, including:
- Estimation of key biodiversity variables such as Leaf Area Index (LAI);
- Examining the fraction of Absorbed Photosynthetically Active Radiation (FAPAR);
- Examining the Fraction Vegetation Cover (FVC) and Canopy Water Content (CWC) using MODIS historical data; and
- Mapping vegetation using MODIS or Landsat to create Enhanced Vegetation Indices (EVI). (Kumar and Mutanga 2018).
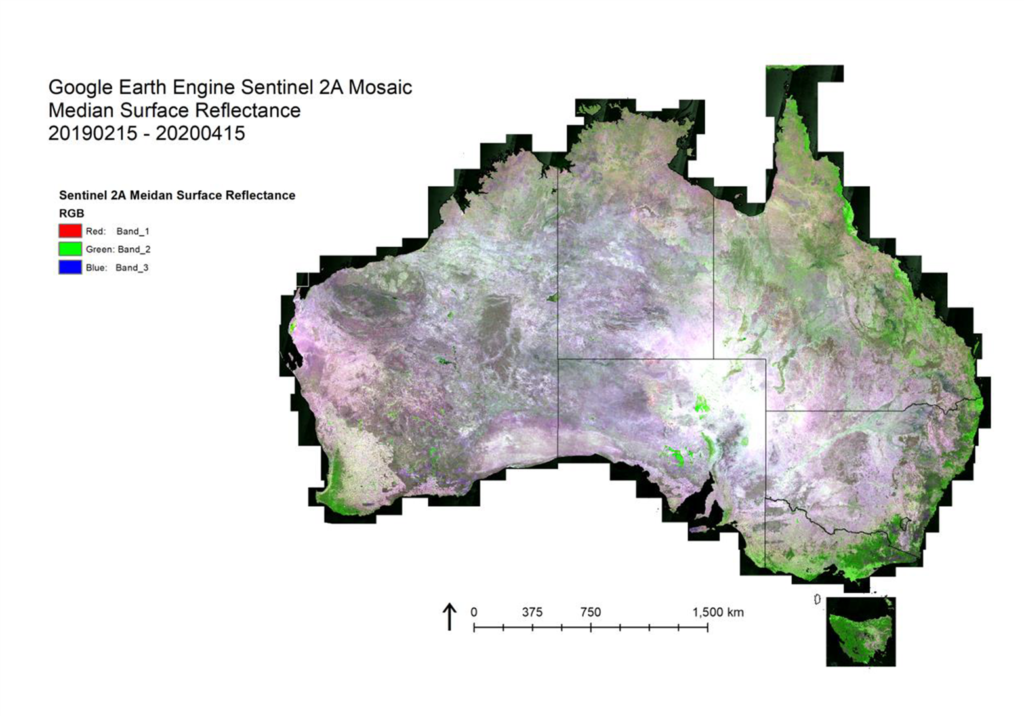
In Australia, the Federal Government, in collaboration with the University of New South Wales, has developed a rapid mapping approach to map fire severity. This tool aims to quantify the impacts of wildfires on flora, fauna, and ecological communities to identify appropriate responses and recovery actions. The GEE Burnt Area Map (GEEBAM) uses the Sentinel 2 images (Figure 4) with a resolution of 15m to classify the burnt area in 4 classes:
- Little change observed between pre and post fire;
- Canopy unburnt – A green canopy within the fire ground that may act as refugia for native fauna, may be affected by fire;
- Canopy partially affected – A mix of burnt and unburnt canopy vegetation; and
- Canopy fully affected – The canopy and understorey are most likely burnt. (Department of Agriculture 2020).
The outcome of mapping fire severity is understanding where potential refuges are and formulating appropriate conservation measures and landscape scale management (Department of Agriculture 2020).
2. Land Cover and Land Use (LCLU)
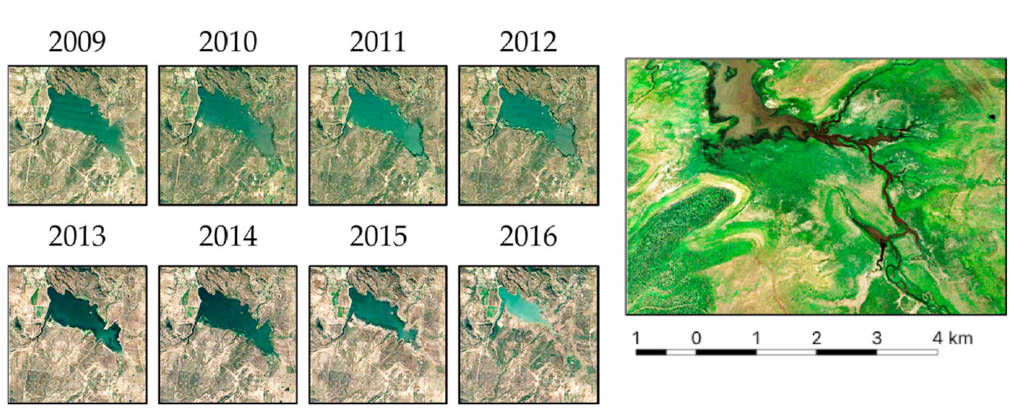
LCLU is a methodology already commonly used by environmental professionals. Geoscience Australia and the Australian Bureau of Agricultural and Resource Economics and Sciences (ABARES) have been working to develop a National Dynamic Land Cover Dataset (DLCD) for Australia using data from MODIS (Richard Lucas 2019). The GEE was used to analyse and view the results for several study areas. The data from a study site in Queensland identified mangrove dieback in the southeastern Gulf of Carpentaria, reduced dam water levels (Figure 5) and an associated expansion of vegetation in Lake Ross, Burdekin (Richard Lucas 2019). There is potential to apply and expand this mapping to cover the whole of Australia to assist with land management practices.
3. Natural Disaster
The UNI-Spider Knowledge Portal platform has been using the GEE as a tool to try to analyse and mitigate natural disasters. They are developing and making codes and scripts designed to monitor environmental elements associated with emergency response. The codes can be applied worldwide to assist with the emergency response following natural disasters or understanding and modelling how a natural disaster may affect an area. The work has documented the following:
- Recommended Practice: Flood Mapping and Damage Assessment using Sentinel-1 SAR data in Google Earth Engine; and
- Recommended Practice: Drought monitoring using the Standardised Precipitation Index -SPI (UNOOSA/UN-SPIDER 2020).
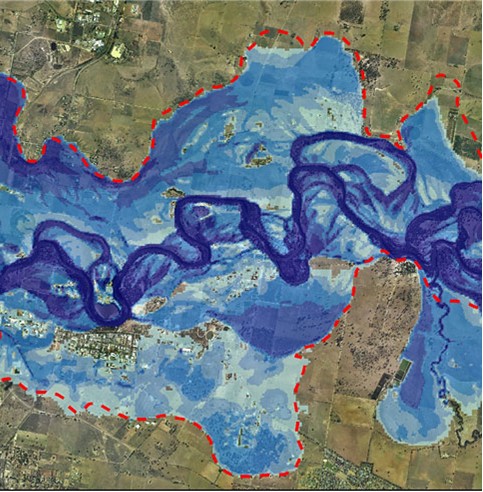
The “Recommended Practice: Flood Mapping and Damage Assessment using Sentinel-1 SAR data in Google Earth Engine” can be used to provide a comprehensive overview of a flood from small communities to States (UNOOSA/UN-SPIDER 2020). In addition to the outline of flood areas, this code produces information about farmland affected to better plan for food security concerns after a disaster and the number of families that have been or could be affected by natural disasters. If you are interested in knowing a little more about these codes and how they work in practice, they are freely available through the UNI-Spider Knowledge Portal.
There are enormous opportunities for using the GEE to analyse remote sensing data on a small scale (such as a mine site or farm) and more broadly. If you or your company is interested in these opportunities, the team at Integrate Sustainability has experience in data acquisition, management and analysis. Please contact us to discuss your spatial and remote sensing data needs to see how we can support you further on (08) 9468 0338 or email enquiries@integratesustainability.com.au.
References
Department of Agriculture, Water and the Environment. 2020. Australian Google Earth Engine Burnt Area Map A Rapid, National Approach to Fire Severity Mapping. Canberra, July 2020, CC BY 4.0.: Department of Agriculture, Water and the Environment.
Gandhi, Ujaval. 2021. Spatial Thoughts. Accessed 05 20, 2021. www.spatialthoughts.com.
Gorelick, N., Hancher, M., Dixon, M., Ilyushchenko, S., Thau, D., & Moore, R. 2017. Google Earth Engine: Planetary-scale geospatial analysis for everyone. Accessed 05 10, 2021. https://earthengine.google.com/platform/.
Kumar, L., and O. Mutanga. 2018. Google Earth Engine Applications Since Inception: Usage, Trends, and Potential. Remote Sens.
Meisam Amani, Senior Member, IEEE, Arsalan Ghorbanian , Seyed Ali Ahmadi , Mohammad Kakooei , Armin Moghimi , S. Mohammad Mirmazloumi, Student Member, IEEE, Sayyed Hamed Alizadeh Moghaddam , Sahel Mahdavi, Masoud Ghahremanloo, Saeid Parsian, Qiusheng Wu. 2020. Google Earth Engine Cloud Computing Platform for Remote Sensing Big Data Applications: A Comprehensive Review. IEEE JOURNAL OF SELECTED TOPICS IN APPLIED EARTH OBSERVATIONS AND REMOTE SENSING, VOL. 13,.
Richard Lucas, Norman Mueller, Anders Siggins, Christopher Owers, Daniel Clewley, Peter Bunting, Cate Kooymans, Belle Tissott, Ben Lewis, Leo Lymburner and raciela Metternicht. 2019. “Land Cover Mapping using Digital Earth Australia.” Earth Observation Data Cubes. Accessed 05 20, 2021. doi:https://doi.org/10.3390/data4040143.
UNOOSA/UN-SPIDER. 2020. United Nations Office for Outer Space Affairs, UN-SPIDER, Knowledge Portal Space-based information for Disaster Management and Emergency Responsa. Accessed 02 2021, 2021. https://www.un-spider.org/advisory-support/recommended-practices/recommended-practice-google-earth-engine-flood-mapping.
USGS. 2020. What is remote sensing? Accessed May 31, 2021. https://www.usgs.gov/faqs/what-remote-sensing-and-what-it-used.